“Where can I find data on when units were received in the warehouse?”
“Ah, well, see, getting the full picture there is tricky…”
If you’re a data user and that response feels familiar, you would find fast friends among the data users at Optoro, our DC technology company. We are frequently confronting the question of how to stand up sturdy analytics and data science in the ever-shifting sands of agile software development.
Amateur data professional Henry David Thoreau wrote “If you have built castles in the air, your work need not be lost; that is where they should be. Now put the foundations under them.”
Our data team built a new foundation. We call it the Concept Layer and it changed how we think about using our data.
Diagnosis: Monolith
Our software solution helps streamline the returns process for our retail clients and their customers, whether they are using our software at their existing supply chain centers or sending their returns to our warehouse outside of Nashville. From the warehouse, our solutions stretch backward into the customer returns experience and forward into recommerce markets for inventory that could re-enter the circular economy. The sheer volume of data generated by our technology drives insight into the performance of our clients’ programs, the intelligence of our software, and even the changes in the returns market at large. Our data has an audience and, regardless of how the software expands, the show must go on.
As a younger company, the easiest way to ensure that data sources for all internal users stayed equally up-to-date was to connect all users to the same data.
With that in mind, we stood up a table called Unit Performance. Tens of millions of rows long (more or less one row per unit in our system) and over a thousand fields wide, this dataset was the go-to source for anyone who needed to answer a business question. Operations team in the warehouse needs to make a manifest of unreceivable units? Unit Performance. Client Success team needs to determine the recovery of goods sold on recommerce sites? Unit Performance. Senior leadership needs health metrics for the company at large? You see where we’re going with this.
As the business developed, however, the limitations of this approach began to appear and a task force was assembled to take stock.
What wasn’t working?
- If Unit Performance went down, the world went down: every internal dashboard, every analytics workbook
- Every use case was subject to the refresh rate of the slowest component of Unit Performance.
- Small requests to add new fields sat in limbo for consideration of the wider impact on business-critical content.
- While units remain the primary grain of our business, not every meaningful analysis needed that depth. For instance, once 200 units are put into a case for bulk resale, any analysis of that case’s performance shouldn’t necessarily start from a unit level.
What was working?
- Everyone was using a shared sense of the truth.
- Everyone knew where they should go for answers.
- Everything refreshed at the same time.
Within those Unit Performance discussions, the question was raised: what if we inserted a database of shared components between raw data and datasets for users? What if making a new dataset for a common use case was so easy that the convenience of Unit Performance no longer outweighed its detriments?
Won’t Someone Please Think of the Analysts?
The principle behind the Concept Layer, simply stated, is that the data used to analyze the business should be:
- structured to look like the business rather than the software
- easy to trace back to its origin source
- easy to update should the technology (or our business) change
- easy to mold for specific use cases
What would that look like in practice? The task force started with the user.
Imagine a new hire on the Optoro data analytics team. They probably understand the reverse logistics workflow pretty well after hearing about it in new hire training, discussing it in their interview, or even learning it through prior experience.
Now imagine them asking their new team members the question from before: where can they find data on when units were received into a warehouse?
We know where this is going. The complexity begins:
- Source 1: The operational inventory database itself, specifically the table containing units in the system and the record creation date.
- Source 2: A receiving event emitted from the warehouse tech team to facilitate reconciliation of problematic units
- Source 3: Another event emitted from our Advance Ship Notice service indicating that an item previously sent in a shipment has now been received at the warehouse
Those three sources are serving distinct and equally valid product needs in the software, each with a different context related to receiving.
Nevertheless, our analyst still has their question. Let’s say they get their answer:
- Source 2 should be prioritized, but it doesn’t cover ALL units
- Source 1 should fill in the units not in Source 2
- Additional fields from Source 3 should be joined in at the end
Perhaps an existing dataset like Unit Performance reflects that prioritization already and the analyst can borrow its code for their work. If it’s not in the code anywhere, maybe the answer comes from a more tenured data team member or a lengthy back-and-forth between the data and development teams. Ultimately, the analyst is unblocked and up to speed.
Now imagine the next new hire on the Optoro data analytics team.
Scrubbing in every new user on the proper prioritization would be an unsustainable solution, much less keeping everyone updated when the prioritization changes or a new source enters the picture. In that scenario, every dataset integrating units received would have to be updated, creating a high risk of consistency drift between datasets. This was, after all, a key justification for using Unit Performance as a single source of truth.
While discussing this scenario, the task force came up with a cascade of questions:
- What if when a user asked for receiving data, they were directed to a table called UNIT_RECEIVED in a database schema called UNIT, with that table’s logic reflecting the company’s consolidated knowledge?
- What if when a change came along, the UNIT_RECEIVED table was updated for the change, immediately updating all downstream datasets?
- What if that approach was taken to every step of the unit’s flow through the warehouse, creating multiple tables under that UNIT schema?
- What if that approach was taken to the entire business and most questions could be directed to a single database (rather than a single table)?
A schema for every entity in our business (unit, case, listing); a table for everything that could happen to an entity; one database for users to build from with confidence.
Data and Product had agreed on a solution.
The Real Analytics Engineers Were Inside Us All Along
Suffice it to say, once the decision was made to design and build a data ecosystem, we needed to do the work. With that in mind, two existing Optoro employees formed the new Analytics Engineering function with the goal of creating an intuitive database broken down into recognizable business entities and the events surrounding them.
Originally, the analytics engineers started each iteration on the Concept Layer with a specific final product and worked backwards. For instance, if recommerce analysts regularly updated a complex query to support an internal dashboard, we looked at their output table and reimagined it in the concept layer framework:
- What entities make up this business function?
- Lots – we sell lots through recommerce channels
- Listings – a lot could be listed on multiple marketplaces
- Orders – multiple lots could be pulled into one order by a customer
- What events could happen to each entity?
- Each event is modeled as a table with timestamps
- What fixed dimensions for each entity are important to the work?
- These were modeled into a single _DETAILS table for each entity
- e.g. UNIT_DETAILS includes a serial number for each unit
- For changeable dimensions, what is the current value today?
- These were modeled into a single _CURRENT table for each entity
- e.g. LOT_CURRENT includes the current listing price for each lot
We answer these questions, build out models using dbt (data build tool), and push those models to production; as we do, the Concept Layer database expands in scope. Business questions become easier to answer as the analysts can browse Concept Layer tables that represent only the information they need and nothing they don’t.
Let’s Get Technical
At long last, here’s where the rubber meets the road. This is also where our narrative turns into technical diagrams:
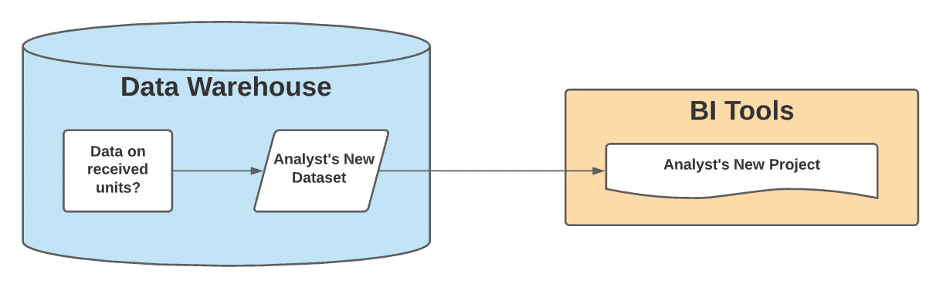
How the Analyst Sees Their Question
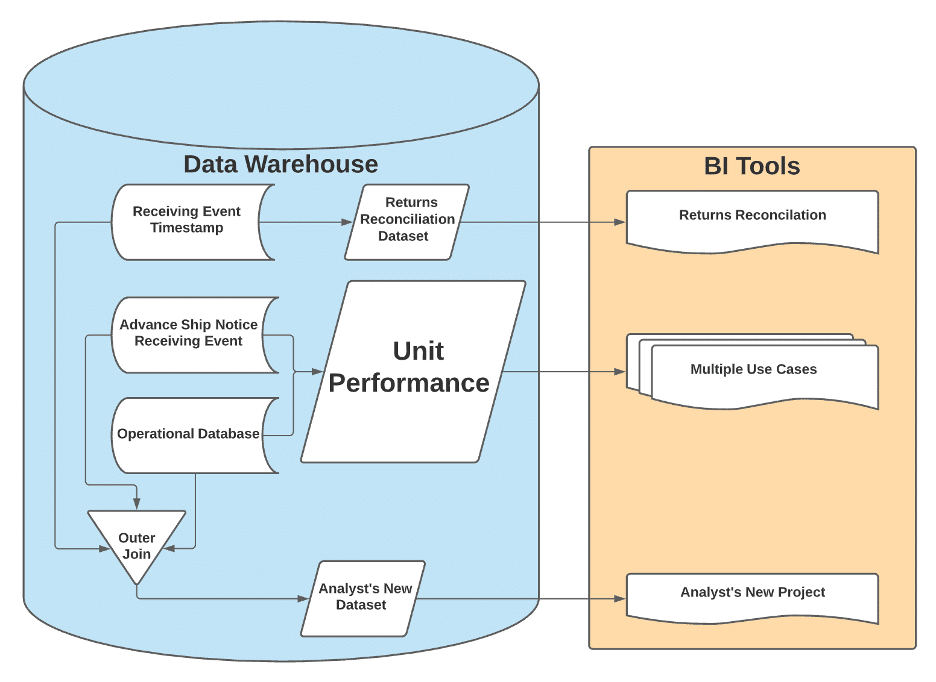
The Answer the Analyst Got in the Past
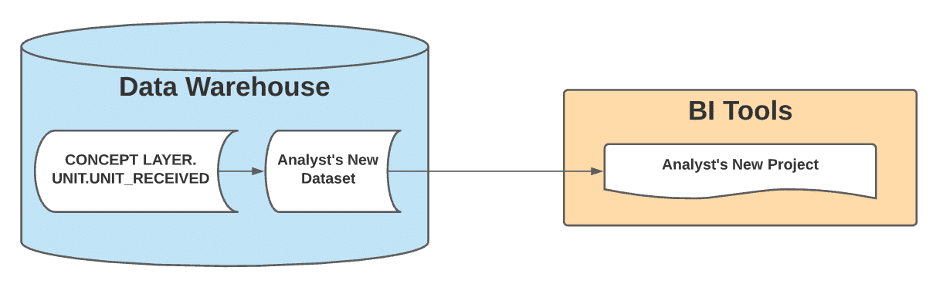
The Answer the Analyst Gets Today
What’s Under the Hood Today
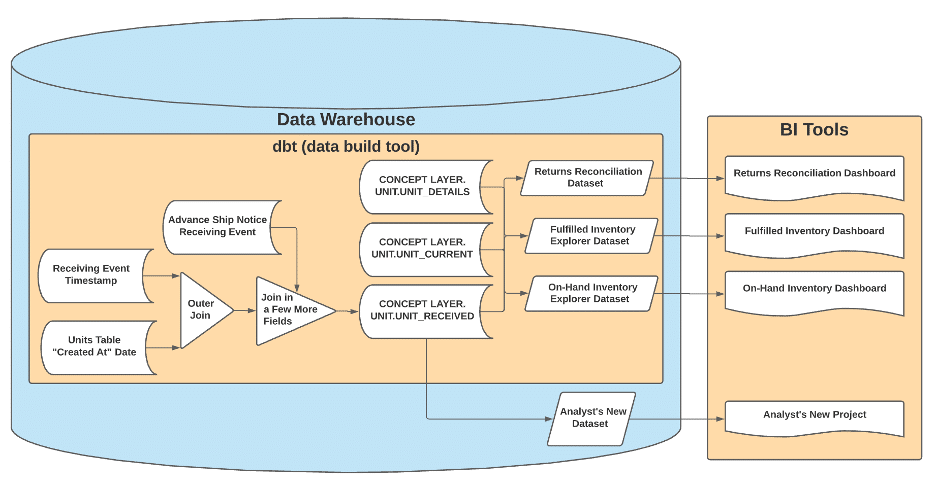
Hard for Us, Easy for Them
Shrewd observers might point out that the “Under the Hood” diagram above looks more complicated than the original answer the analyst got. Why is that? Because the final diagram is the realm of the Analytics Engineers. It’s our team’s job to dig into the data produced by our software teams and identify the business concepts. Sometimes that means braiding three data sources into one. Sometimes that means flattening a single JSON blob several times over to create three separate Concept Layer entities. Sometimes it’s hard; sometimes it’s frustrating; sometimes we want to flip our desks.
When those moments come, the Analytics Engineering team has developed a bit of a mantra: “Hard for us, easy for them.” It’s a reminder to take a breath and accept the complexity because it’s our job to confront that complexity, capture it in our code, version control it, and then present this to data users:

Initial feedback has confirmed that our users now spend less time scrubbing in on software complexity and more time doing their work. They can navigate the data in the language of their business question. If the Concept Layer doesn’t surface what they need, they can submit a ticket to include additional fields; in fact, because the database architecture is intuitive, they often suggest exactly where they’d expect to see a new field surfaced.
It’s hard for us so it can be easy for them. And as Jimmy Dugan would say, “The hard is what makes it great.”